by Matt Piotrowski
Vehicle miles traveled (VMT) have soared in recent years, in large part due to weaker oil prices.
Lower costs for traveling by car or truck have motivated consumers to take to the road in record numbers.
U.S. motorists are forecast to top last year’s record of 3.2 trillion miles in 2017, with the number rising again in 2018, according to the U.S. Energy Information Administration (EIA).
VMT declined in 2008 in the aftermath of the financial crisis and then stabilized through 2014, before steadily rising over the past few years.
Lower pump prices are not the only reason for increased travel—economic growth and rising household income are also underpinning VMT.
Are ride-sharing services another possible factor behind the boom in VMT?
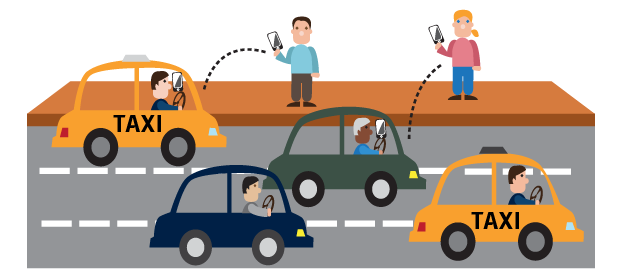
The number of users of services like Lyft and Uber has accelerated in the past several years, prompting some critics to suggest they are behind increased congestion and growth in VMT.
It would be premature to point to ridesharing as a major aspect behind the VMT surge.
It would be premature, however, to point to ridesharing as a major aspect behind the VMT surge.
For the most part, shared mobility services are confined to urban areas and are used to complement car ownership or other services, such as public transportation or taxicabs.
There are a wide variety of motivations for users of these services, and some drivers work full-time while others are part-time to make extra money.
The full-scale impact of ridesharing is not fully known right now but it is a subject of scrutiny and study.
So far, the research shows that it counts for only a small portion of VMT.
Consultancy McKinsey & Company says that ridesharing makes up only one percent of the country’s total miles traveled, based on data from Uber and Lyft.
Other factors carry more weight behind increases in VMT.
Along with relatively low and stable gas prices, the broader economic picture cannot be ignored.
The U.S. economy rose by 3 percent in the second quarter, the strongest growth since the beginning of 2015.
For 2017, growth is expected to be greater than 2 percent.
The strong economic activity is increasing the movement of goods across the country.
One of the best indicators of economic growth is diesel demand.
It is forecast to rise by 110,000 barrels per day this year, reflecting the rise in trucking and increase in demand for freight shipments.
By contrast, diesel demand fell in 2016.
Gasoline demand is holding steady versus year-ago levels despite the rise in VMT, thanks in large part to increased fuel economy.
Gasoline demand, meanwhile, is holding steady versus year-ago levels despite the rise in VMT, thanks in large part to increased fuel economy.
Americans are driving more partially as a result of higher household income.
The median household income in the U.S. was approximately $59,000 in 2016, rising for two straight years. The increase in income has occurred at the same time gasoline prices have remained low.
When gasoline expenditures are a smaller part of income, motorists tend to travel more.
In 2013, the year before retail gasoline prices fell from the $4 per gallon level, gasoline expenditures accounted for about 4 percent of pretax income.
Now, that number is below 2 percent.
Electric vehicles and autonomous technology will likely be paramount in reshaping on-demand services and car ownership in the future.
The future impact of ride-sharing and other new mobility sources is far from certain. Electric vehicles and autonomous technology will likely be paramount in reshaping on-demand services and car ownership in the future.
The continued expansion of ride-sharing is poised to affect the country’s transportation habits and consumer preferences, but it’s important to keep in mind that VMT and oil demand are made up of a complex set of factors.
More data and research are needed to better understand ride-sharing’s larger impact.
